Armada Power Fleet Commander
User Guide - Property Managers
Fleet Commander by Armada Power is a dynamic platform designed to help property managers, utilities, and operators efficiently oversee fleets of smart water heaters. With intuitive dashboards, real-time insights, and flexible device control, it supports better grid reliability, energy efficiency, and preventative maintenance.
Logging In & Logging Out
Accessing Fleet Commander
When you’re granted access to the Fleet Commander platform, you’ll receive an email with a personalized link, your username (typically in the format FirstName.LastName), and a temporary password.
Tip: We recommend logging in as soon as possible and updating your password.
Step-by-Step Guide: Logging In
- Click the login link from your welcome email.
- Enter your Username or Email and Temporary Password.
- (Optional) Select Remember Me to keep your session active.
- Click the Sign In button.
- On first login, follow the prompt to set a new password.
Tip: Choose a strong, secure password that you don’t use elsewhere.
Logging Out
- Click your profile icon or name at the top right of the screen.
- Select Log Out from the dropdown menu.
- You will be securely signed out and redirected to the login screen
Home Page Overview
1. Introduction
The Home Page serves as your central dashboard, providing a high-level overview of water heater fleet performance, active alerts, and property details. From this screen, users can quickly assess system status, view alerts, and navigate to detailed reports for deeper insights.
2. Key Functions of the Home Page
The Home Page is divided into several key sections:
| Section | Description | |
|---|---|---|
| A | Navigation Menu (Left Sidebar) | Provides access to key platform features: Devices, Alerts, Maps, Properties, and Addresses. |
| B | Main Dashboard Buttons | Quick access to key sections: Devices, Device Map, Alerts, and Alert Map. |
| C | Real-Time Water Heater Power Usage |
Displays a 15-minute power usage graph for selected properties. |
| D | Active Alerts Panel | Summarizes open alerts by severity and type. |
| E | Properties List | Displays managed properties with device count and active alerts. |
| F | Actions Panel | Allows users to respond to alerts, acknowledge issues, or mute notifications. |

3. Step-by-Step Guide: Navigating the Home Page
Using the Navigation Menu
- The left sidebar menu provides quick access to different sections of the platform.
- Click on Fleet to expand options for Devices, Device Map, Alerts, and Alert Map.
- Click on User Management to access account settings and permissions.

Home Page Dashboard
- The main dashboard displays quick-access buttons for:
- Devices: View all connected water heaters.
- Device Map: Visualize device locations.
- Alerts: Monitor and address system warnings.
- Alert Map: View alerts geographically.
- Click on any of these buttons to navigate directly to that section

Navigating the Viewing Property Panel
- Before a property is selected in the Properties section below, the default table will display:
- All Connected Devices
- Total Devices
- Open Alerts
*Note* To view Real-Time Water-heater Power Usage, click on the property name in the Properties panel below.
- The Property Name will replace the Viewing All Properties in the section above.

- Click () to open The Real-Time Water Heater Usage (Last 15 min.):
- Check weather conditions at the property.
- The graph shows the past 15 minutes of power consumption.
- Hover over the graph to see exact power values at different timestamps.
- If unexpected spikes occur, check the Active Alerts Panel to identify potential issues.

Navigating the Properties Panel
- When the View All option is selected, the table will display:
- Your Property Name
- Connected Devices
- Open Alerts
- Click on your property name.
- A red dot will appear beside your property name to indicate it has been selected.

- The Device Chart button will become available.
- Clicking on the Device button provides a pop-over with a Device Status & Health Map.
- Displays data about temperature and connectivity data for all devices at the property.
- To customize your view, select ˚C or ˚F and Size by Temperature or Connection, then select Refresh ( ).
- Devices with alerts are indicated by ( ).
- Click the menu ( ) to view in full-screen mode or choose from the data download options.
- Hover over the chart to get more detailed device-level data.
- Click anywhere outside the chart to return to the Fleet Management Home dashboard

Managing the Active Alerts Panel
- The Active Alerts panel categorizes the number of alerts by severity:
- Blue: Low – Not urgent but may indicate a future issue; monitor for changes.
- Yellow: Moderate – Needs attention when resources allow.
- Orange: High – Needs attention when resources allow.
- Red: Severe – Potentially dangerous situation requiring immediate action.
- Dark Red: Critical – Act now to prevent significant damage or safety risks!
- The total number of alerts for each category is indicated by the number in the red dot.
- You can also view the total number of alerts by type in the Type Totals panel.

- Use the Alerts Detail and Action Panel to better understand, prioritize, and act on alerts.
- Click on a column header to sort by severity, type, status, or other attributes.

- Click on an alert row to view the Alert Details.
- See device-specific details, including:
- Severity level
- Type of alert
- State (i.e., Acknowledge)
- If moisture is detected and the moisture score
- Who the alert is assigned to for further action
- Device location
- Latest timestamp
- View the location of the device on a map.
- Adjust the time zone.
- View the Sensor Value, which dynamically changes between moisture, temperature, and usage values based on the type of alert, and view the Alert Time chart.
- Hover over the chart for more detailed data
- Mark the alert as Acknowledged ( ) or Resolved ( ) or Assign ( ) an alert from this screen.
- Click the Go to Device button to navigate to the Device Details page. (More on this in the Devices Section
- See device-specific details, including:

- Acknowledge an alert ( ). Click on the icon.
- When you click on the acknowledge alert icon ( ) the icon will switch to ( ). You can click on this icon to undo Acknowledge Alert

- Resolve an alert ( ). Click on the icon and in the pop-up window you can:
- Add a Resolve Message.
- Choose between Resolve Now and False Report.
- Choose to Cancel or Confirm.

- Assign an alert ( ) (requires admin credentials). Click on the icon and in the pop-up window you can:
- Use the drop-down menu to to select the Assign To person.
- Once assigned, they will automatically receive an email to let them know about this alert including, type, severity, location, etc.
- You may also enter their email address to resend the alert notification with an optional message.
- Use the Send Email button to send the email.
- Use the Remove Assigned button to remove the assignee from the alert.
- Use the drop-down menu to to select the Assign To person.

4. Tooltips & Definitions
| Feature | Description |
|---|---|
| Severity Levels | Color-coded alert categories (Low, Moderate, High, Severe, Critical). |
| Connected Devices | Number of water heaters online and reporting data. |
| Alerts | System-generated warnings related to device performance, leaks, or outages. |
| Power Usage Graph | Displays real-time energy consumption of the fleet. |
| Actions Panel | Allows users to acknowledge, mute, or resolve alerts. |
| Actions Panel | Allows users to respond to alerts, acknowledge issues, or mute notifications. |
5. Troubleshooting Tips
| Issue | Possible Solution |
|---|---|
| Graph Not Displaying Data | Ensure the selected property has active, connected devices. Refresh the page. |
| High Alert Count | Click the Alerts Panel to review details and address priority issues first. |
| Unable to Assign Alerts | Ensure you have the correct user permissions under the User Management sidebar menu > View Profile. |
| Navigation Menu Not Working | Log out and back in or clear your browser cache. |
Devices Page Overview
1. Introduction
The Devices Page provides a detailed list of all connected water heaters in the Armada Power Fleet Commander Platform. You can use this page to monitor device health, view alerts, and manage individual devices efficiently. Clicking on a device will open its Device Details Page, where you can access in-depth information and control options.
2. Key Functions of the Devices Page
| Section | Description | |
|---|---|---|
| A | Device List | Displays all water heaters, including key status indicators. |
| B | Search & Filters | Enables users to search for specific devices by ID, address, property, model, or serial number. |
| C | Export Data | Export device data as a CSV or Excel file. |
| D | Status Indicators | Shows whether a device is online, offline, or has alerts. |
| E | Device Details Page | Click a device row to open a detailed view with multiple tabs for monitoring and configuration. (Not pictured here) |

3. Step-by-Step Guide: Navigating the Devices Page
Viewing and Searching Devices
Click on Devices from the button on the homepage or the left sidebar.
- Select between Celsius and Fahrenheit.
- Select the property from the Current Property drop-down.
- If you manage a single property, this will be the default property shown in the table.
- Use the Hide Column drop-down to customize the table to display your preferred data.
- Enter your preferred search terms in the open Search field or use the Search Field drop-down to filter by:
- Address
- Property Name
- Serial Number
- Model Number
- Device ID
- Click the Search button to initiate the search.
- Click the Export Data button to download a CSV or Excel file of the table data.
- The table will display all devices associated with the selected property.
- Click on a column header to sort by Address, Alerts, or other attributes.
- Click on a device row to view the Device Details page.

Understanding Device Alerts and and Connection State Indicators
Each device is marked with a color-coded Alert status indicator:
- Red Alert Icon – Device has active alerts that need attention. ( )
- Gray Warning Icon – Device connection status is unknown. ( )
- Green Checkmark – Device is online and functioning normally. ( )
- Yellow Connection Icon – Device connection lost. ( )
Filtering and Exporting Device Data
- Click Current Property to select a specific location.
- If you manage only one property, this will be the default device data you see in the table.
- Click the Hide Columns drop-down to customize the displayed information.
- Use the Export Data button to download device information in a spreadsheet format.
- Click on a column header to sort by Address Property Name, Alerts or other attributes.
- The table will update dynamically based on the filters applied.

Accessing Device Details
- Click on any device ID or table row to open the Device Details page.
- The initial Device Detail Page provides an Overview with:
- Connection State
- Overall Connection Percentage
- Device Model
- 7, 14, and 30-Day Connected Time Percents
- Current Device Alerts (if any)
- The option to View Alert History
- Device Usage Data
- Additional tabs on this page provide deeper insights into device performance.

4. Device Details Page Overview
Viewing and Searching Devices
Clicking on an individual device, takes you to the Device Details Page, which contains multiple tabs:
| Feature | Description |
|---|---|
| Severity Levels | Color-coded alert categories (Low, Moderate, High, Severe, Critical). |
| Connected Devices | Number of water heaters online and reporting data. |
| Alerts | System-generated warnings related to device performance, leaks, or outages. |
| Power Usage Graph | Displays real-time energy consumption of the fleet. |
| Actions Panel | Allows users to acknowledge, mute, or resolve alerts. |
| Actions Panel | Allows users to respond to alerts, acknowledge issues, or mute notifications. |
5. Step-by-Step Guide: Device Details Page
Overview Tab at a Glance
- The Overview tab shows key real-time data, including:
- Device Model and Serial Number
- Location Information
- Connection State and Connection (%)
- LTE Connection and Wi-Fi and WiFi State
- Set Vacation Mode button
- Click on the button to select an end date and time for Vacation Mode or remove a current date.
- Click on Select date/time for calendar and time picker.
- Select Cancel or Apply.

- The Current Device Alerts section lists any active issues.
- Mark the alert as Acknowledged ( ) or Resolved ( ) or Assign ( ) an alert from this screen.
- Click on the View Alert History button to see past alerts.

- Click on any Current Device Alerts table row to view that Alert Details screen to review and act on device specific details, including:
- Severity level
- Type of alert
- State (i.e., NEW)
- If moisture is detected and the moisture score
- Who the alert is assigned to for further action
- Device location
- Latest location and timestamp
- View the location of the device on a map
- Adjust the time zone
- View the Moisture Sensor Value and Alert Time chart.
- Hover over the chart for more detailed data
- Mark the alert as Acknowledged ( ) or Resolved ( ) or Assign ( ) an alert from this screen.

- Select the Usage Graph tab, which shows power consumption over time.
- Select Celsius or Fahrenheit.
- Adjust the start and end dates, or click one of the preset time ranges and click the Apply Dates button to adjust the graph data.
- Click Enable Zoom to inspect specific data points.
- Click the Refresh icon ( ) to update the graph with the latest data.

- Select the Moisture Sensor tab, which shows leak detection trends.
- Adjust the start and end dates, or click one of the preset time ranges and click the Apply Dates button to adjust the graph data.
- Click Enable Zoom to inspect specific data points.
- Click the Refresh icon ( ) to update the graph with the latest data

Managing Alerts in the Alerts Tab
- Click the Alerts tab to view Alert Information
- Use the Filter by Type or Filter by State options to prioritize alerts.
- In the Alert History table view:
- Alert Severity Level (High, Moderate, Low)
- Alert Type (Leak, Temperature, Connection Issue)
- Status (New, Acknowledged, Resolved)
- Act on an alert in the Alerts Column.
- Acknowledge an alert ( )
- Resolve an alert ( )
- Assign an alert ( )

- Click on any Alert History table row to see the Alert Details screen to review and act on device details, including:
- Severity level
- Type of alert
- State (i.e., NEW)
- If moisture is detected and the moisture score
- Who the alert is assigned to for further action
- Device location
- Latest location and timestamp
- View the location of the device on a map.
- Adjust the time zone.
- View the Moisture Sensor Value and Alert Time chart.
- Hover over the chart for more detailed data
- Mark the alert as Acknowledged ( ) or Resolved ( ) or Assign ( ) an alert from this screen.

Analyzing Device Data in the Graphs Tab
- Click the Graphs tab to view:
- The Device Usage Graph shows power consumption over time.
- Select Celsius or Fahrenheit
- Adjust the start and end dates, or click one of the preset time ranges and click the Apply Dates button to adjust the graph data.
- Click Enable Zoom to inspect specific data points.
- The Device Usage Graph shows power consumption over time.

- The Moisture Sensor graph shows leak detection trends.
- Adjust the start and end dates, or click one of the preset time ranges and click the Apply Dates button to adjust the graph data.
- Click Enable Zoom to inspect specific data points.
- Click the Refresh icon (Show Icon) to update the graph with the latest data.
- The WiFi Connectivity graph shows device connectivity over time.
- The LTE Connectivity graph shows device connectivity over time.

- The WiFi Connectivity graph shows device connectivity over time.

- The LTE Connectivity graph shows device connectivity over time.
Viewing Device Information
- Click the Information tab for detailed Current Device Status information, including:
- Connection State and Percentage
- State of Charge Percent and State
- Top & Bottom Temperature Readings
- State of Charge and Status Timestamps
- Controller State
- Power and Frequency
- Last Autoset Date and Time
- Vacation and Bypass Status
- Portal Registration Status

Adjusting Settings in the Device Configuration Tab
- Click the Configuration tab to view device parameters, including:
- Water Heater Details
- Maximum and Minimum Alert Temperatures
- Minimum and Maximum Top and Bottom Temperature Ranges
- Leak Sensor Threshold
- Select the Device Mode (Regulation, Standby, Maintenance, etc.).
- Select the Thermistor Swap mode (Auto, Fixed Swap, or No Swap).

Reviewing Status History
- Click the Status History tab to view:
- Timestamped logs of device activity
- Energy accumulation records
- Current, voltage, and frequency data
- This section provides insights into long-term device behavior.

6. Tooltips & Definitions
| Feature | Description |
|---|---|
| Connection State | Color-coded alert categories (Low, Moderate, High, Severe, Critical). |
| Alerts | Number of water heaters online and reporting data. |
| Max Alert Temperature | System-generated warnings related to device performance, leaks, or outages. |
| Leak Sensor Threshold | Displays real-time energy consumption of the fleet. |
7. Troubleshooting Tips
| Issue | Possible Solution |
|---|---|
| Device Not Appearing in List | Check if the correct property is selected. Refresh the page. |
| Device Shows as Offline | Verify power supply and network connection. |
| Unable to Assign Alerts | Ensure you have the correct user permissions under the User Management sidebar menu > View Profile. |
| No Data in Graphs | Adjust the date range and click Refresh. |
| Configuration Changes Not Saving | Confirm user permissions and retry. |
Device Map Overview
1. Introduction
The Device Map Page visually represents all connected water heaters across properties. This interactive map helps You monitor system-wide device distribution, identify connectivity issues, and quickly locate offline or malfunctioning devices. You can hover over device markers for quick status summaries and click on devices for more detailed information.
2. Key Functions of the Device Map
| Section | Possible Solution |
|---|---|
| Interactive Map | Displays all connected devices with color-coded status indicators. |
| Property Selector | Allows users to filter devices by property. |
| Device Model Filter | Enables filtering by specific device models. |
| Connection Status Key | Provides a legend explaining device connectivity levels. |
| Device Hover Functionality | Quick view of a device’s connection state, model, and address on hover. |
| Device Details | Clicking on a device displays additional information and a link to the Device Details Page. |
3. Step-by-Step Guide: Using the Device Map
Navigating the Map
- Click on Device Map from the homepage button or the left sidebar.
- The map will display all devices associated with the currently selected property.
- Use the zoom controls (+/-) or scroll with your mouse to focus on a specific area.

Navigating the Map
- Click the Current Property drop-down to select a specific location.
- Click the Device Model drop-down to filter by:
- All Models
- LCS2100 (Wi-Fi)
- LCS2400 (Wi-Fi)
- LCS2400CW (Wi-Fi/LTE)
- LCS2400CW2 (Wi-Fi/LTE)
- The map will update to show only devices that match the selected criteria.
Understanding Device Status Indicators
Each device is color-coded based on its connection health:
| Color | Connection Status | |
|---|---|---|
 |
Green (90–100%) | Device is fully connected and operating normally. |
 |
Yellow (60–89%) | Device has a weaker connection but is still functional. |
 |
Red (1–59%) | Device has a poor connection and may be experiencing issues. |
 |
Burgundy (0%) | Device is completely offline and not communicating. |
 |
Gray | Device has not been commissioned or is unregistered. |
Viewing Detailed Device Information
- Click on a device marker on the map to open a detailed popup.
- The popup will provide:
- Address
- Connection State (e.g., Connected, Unknown, Offline)
- Connection Percentage
- Device Model
- Click View Device to navigate to the Device Details Page for advanced options.

4. Tooltips & Definitions
| Feature | Description |
|---|---|
| Connection Status | Indicates the health of a device’s communication with the platform. |
| Device Model | Identifies the specific hardware type installed at a property. |
| Property Selector | Allows users to switch between managed locations. |
| Device Marker | A color-coded icon representing each water heater on the map. |
| Detailed Popup | Displays a quick view of a device’s details when device marker is clicked. |
| Zoom Controls | Enables users to adjust the map’s view to focus on specific areas. |
5. Troubleshooting Tips
| Issue | Possible Solution |
|---|---|
| Device Missing from Map | Ensure the correct property is selected. Refresh the page. |
| Device Shows as Offline (Black) | Check the Devices Screen for last communication data. |
| Poor Connection (Red/Yellow) | Investigate network strength and device location. |
| Device Markers Not Loading | Refresh the page or check your internet connection. |
| Incorrect Device Location | Verify the property assignment in the Properties Screen. |
| Hover Popups Not Appearing | Try hovering again or refresh the page. Ensure the device is properly registered. |
Alerts Page Overview
1. Introduction
The Alerts Page provides a centralized location for monitoring, assessing, and responding to system-generated warnings related to the water heater fleet. Alerts are categorized by severity and type, allowing you to prioritize critical issues and take action accordingly.
2. Key Functions of the Alerts Page
| Section | Possible Solution |
|---|---|
| Property Selector | Allows users to filter alerts by specific properties. |
| State, Severity, and Type Filters | Enables users to refine the alert list based on alert status (e.g., new, resolved), severity level, and type (e.g., leak, temperature issue). |
| Alerts Table | Displays key details like address, severity, type, status, timestamps, and assignment. |
| Actions Panel | Provides options to acknowledge, assign, or resolve alerts. |
| Export Data Button | Allows users to download alert data for record-keeping or analysis. |
3. Step-by-Step Guide: Navigating the Alerts Page
Viewing and Filtering Alerts
- Click on Alerts from the homepage button or the left navigation menu.
- Select a property from the Current Property drop-down to view alerts for a specific location.
- Use the State, Severity, and Type filters to refine the alerts displayed:
- State: NEW, Acknowledged, Resolved.
- Severity: High, Moderate, Low.
- Type: Leak, Temperature, Connection Issue.
- Hover over the severity status in the Severity column for status details.
- Click on a column header to sort by severity, type, status, or other attributes.
- The table will update dynamically based on the filters applied.

Exporting Alert Data
- Click the Export Data button at the top-right of the Alerts page.
- Select a format (CSV or Excel) to download a report of all displayed alerts.
- The exported file will include details such as timestamp, severity, alert type, and assigned user.
Viewing and Managing Alerts
- Scroll through the Alerts Table to review open alerts.
- Click on any alert row in the table to see the Alert Details screen.
- Review and act on device-specific details, including:
- Severity level
- Type of alert
- State (i.e., NEW)
- If moisture is detected and the moisture score
- Who the alert is assigned to for further action
- Device location
- Latest location and timestamp
- View the location of the device on a map.
- Adjust the time zone
- View the Moisture Sensor Value and Alert Time chart.
- Hover over the chart for more detailed data
- Mark the alert as Acknowledged ( ) or Resolved ( ) or Assign ( ) an alert from this screen.
- Review and act on device-specific details, including:
- Use the Actions column in the alerts table to:
- Acknowledge an alert. ( )
- Resolve an alert. ( )
- Assign an alert. ( )

4. Tooltips & Definitions
| Feature | Description |
|---|---|
| Severity Levels | Color-coded categories indicating urgency. |
| Assigned To | Shows whether an alert has been assigned to a specific user. |
| First Observed | The date and time the alert was initially detected. |
| Last Observed | The most recent time the alert was registered by the system. |
| Actions Panel | Options to acknowledge, resolve, or assign alerts. |
5. Troubleshooting Tips
| Issue | Possible Solution |
|---|---|
| Alerts not updating | Refresh the page or check the property selection. |
| Unable to acknowledge alerts | Ensure the correct user permissions are enabled. |
| High alert count | Review alerts by severity and address high-priority items first. |
| Exported file missing data | Adjust filters before exporting to ensure all necessary alerts are included. |
Alert Map Overview
1. Introduction
The Alert Map provides a geospatial visualization of system alerts, allowing you to quickly identify and respond to issues across multiple locations. The map displays active alerts by severity and type, helping you assess the distribution of issues across your property or portfolio.
2. Key Functions of the Alert Map
| Section | Description |
|---|---|
| Property Selector | Allows users to select a specific property for alert monitoring. |
| Alert Type & Severity Filters | Enables users to filter alerts based on issue type (e.g., leak, temperature) and urgency level (e.g., moderate, high). |
| Interactive Map | Displays alerts as color-coded markers, each representing an alert type and severity. |
| Alert Severity Legend | Provides a reference guide for alert categories and colors. |
| Actions Panel | Allows users to click on alert markers to view more details and take action. |
3. Step-by-Step Guide: Navigating the Alert Map
Selecting a Property for Monitoring
- Click on Alert Map from the button on the homepage or the left navigation menu.
- Use the Current Property dropdown to select a specific location.
- The map will update to show alerts associated with the selected property.

Understanding Alert Markers and Severity Levels
Each alert appears as a color-coded marker on the map, indicating severity and type:
| Color | Severity | Connection Status | |
|---|---|---|---|
 |
Blue | Low | Monitor for changes. |
|
Yellow | Moderate | Requires attention when resources allow. |
 |
Orange | High | Needs prompt action to prevent potential issues. |
|
Red | Severe | Immediate action required to prevent significant problems. |
 |
Dark Red | Critical | Urgent intervention needed to prevent damage or safety risks. |
Filtering Alerts by Type and Severity
Each alert appears as a color-coded marker on the map, indicating severity and type:
- Click the Filter by Type drop-down to refine alerts based on specific categories, such as:
- Leak
- High Temperature
- Low Temperature
- High Usage
- Low Usage
- Power Issues
- Other Alerts
- Click the Filter by Severity drop-down to view alerts of a particular urgency level (e.g., High, Moderate).
- The map will dynamically update to reflect the selected filters.

Viewing and Managing Alerts on the Map
- Click on any alert marker to open a detailed pop-up.
- Click on the View Alert Details link in the pop-up to review and act on device-specific details, including:
- Severity level
- Type of alert
- State (i.e., NEW)
- If moisture is detected and the moisture score
- Who the alert is assigned to for further action
- Device location
- Latest location and timestamp
- View the location of the device on a map.
- Adjust the time zone.
- View the Moisture Sensor Value and Alert Time chart.
- Mark the alert as Acknowledged ( ) or Resolved ( ) or Assign ( ) an alert from this screen.
- Use the Actions column in the alerts table to:
- Acknowledge an alert. ( )
- Resolve an alert. ( )
- Assign an alert. ( )

4. Tooltips & Definitions
| Feature | Description |
|---|---|
| Alert Markers | Color-coded icons representing active alerts on the map. |
| Severity Filters | Dropdown menu allowing users to filter alerts by urgency level. |
| Property Selector | Enables users to switch between monitored locations. |
| Interactive Pop-up | Displays alert details when clicking on an alert marker. |
| Legend Panel | Provides an overview of alert types and severity colors. |
5. Troubleshooting Tips
| Issue | Possible Solution |
|---|---|
| Alerts not appearing on map | Ensure the correct property is selected. Refresh the page. |
| Unable to Assign Alerts | Ensure you have the correct user permissions under the User Management sidebar menu > View Profile. |
| Clicking on markers does nothing | Refresh the page or check user permissions. |
| High number of alerts displayed | Use filters to refine the alert view by severity or type. |
Properties Page Overview
1. Introduction
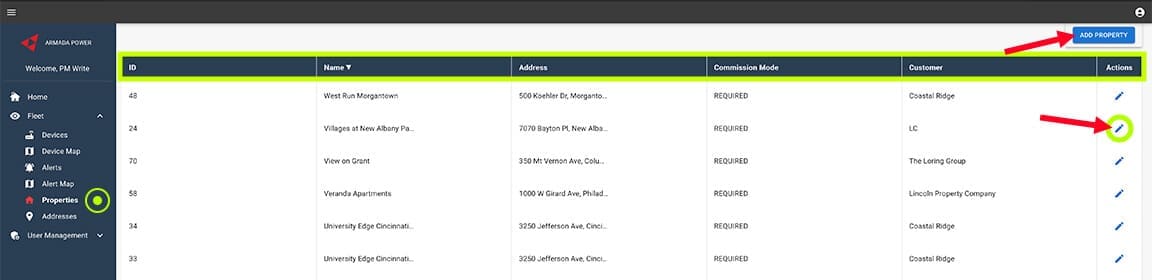
The Properties Page allows you to view and manage all properties associated with your Armada Power Fleet Commander account. This section provides a centralized list of properties, displaying key details such as property name, address, commission mode, and associated customer. Users with the correct permissions can add new properties or edit existing ones, ensuring accurate data management.
2. Key Functions of the Properties Page
| Section | Description |
|---|---|
| Property List | Displays all managed properties, including ID, Name, Address, Commission Mode, and Customer. |
| Add Property Button | Allows users with proper permissions to add a new property. |
| Edit Property Action | Users with appropriate access can update property details by clicking the Edit icon. |
| Search & Pagination | If multiple properties exist, users can search for a property and navigate through pages. |
3. Step-by-Step Guide: Navigating the Properties Page
Viewing and Searching Properties
- Click on Properties from the left navigation menu.
- If multiple properties exist, they will be displayed in a sortable table.
- Click on a column header to sort properties by ID, Name, Address, Commission Mode, or Customer.
Adding a New Property (Permission Required)
Only users with the correct permissions can add new properties.
- Click the Add Property button (top-right corner).
- Enter the required details:
- Name
- Address
- Customer
- Default Nameplate Power
- Default Nominal Voltage
- Default Tank Size
- Commission Mode (if applicable)
- Click the box to create a new registration ID for the property or select from the Registration dropdown menu.
- Click Save to add the new property or Cancel to exit.
- Toggle the address
Click Images to Enlarge


Edit an Existing Property (Permission Required)
Only users with the correct permissions can add new properties.
- Locate the property in the table.
- Click the edit icon ( ) in the Actions column.
- Modify the necessary details.
- Toggle to make the property Active, or inactive.
- Click Save to update the property information or Cancel to exit.
View Property Insights
- Click on the Property ID in the Properties list table for insights, including:
- Energy usage data
- Device connection data
- Device counts
- Date of last update

4. Tooltips & Definitions
| Feature | Description |
|---|---|
| ID | Unique identifier assigned to each property. |
| Name | The designated name of the property. |
| Address | The physical location of the property. |
| Commission Mode | Indicates if commissioning is Required, Optional, or Not Needed. |
| Customer | The company or entity associated with the property. |
| Actions | Allows authorized users to edit property details. |
5. Troubleshooting Tips
| Issue | Possible Solution |
|---|---|
| Unable to add a new property | Ensure you have the correct permissions. Contact an administrator. |
| Edit icon not visible | Only authorized users can edit properties. Confirm user permissions. |
| Incorrect property details displayed | Edit the property (if permitted) or contact support for corrections. |
Addresses Page Overview
1. Introduction
The Addresses Page provides a detailed list of all unit-level addresses associated with a property. Each address corresponds to a specific unit, apartment, or location within a managed property and includes key details such as associated property, registration status, and device count. Users with the correct permissions can add, edit, or delete addresses and export address data for record keeping or analysis.
2. Key Functions of the Addresses Page
| Section | Description |
|---|---|
| Address List | Displays all registered addresses, including ID, Address, Associated Property, Registration Status, and Device Count. |
| Property Selector | Allows users to filter addresses by a specific property. |
| Column Sorting | Users can click on column headers to sort data by ID, Address, or other attributes. |
| Add Address Button | Users with appropriate permissions can add a new address. |
| Edit Address Action | Users with the correct access can update address details using the Edit icon. |
| Delete Address Action | Users with the correct access can remove addresses using the Delete icon. |
| Export Data Button | Users with appropriate permissions can download address data in CSV or Excel format. |
3. Step-by-Step Guide: Navigating the Addresses Page
Viewing and Searching Addresses
- Click on Addresses from the left navigation menu.
- The default view displays a list of all registered addresses.
- Use the Current Property dropdown to filter addresses by a specific property.
- Click on column headers (e.g., ID, Address, Device Count) to sort the list accordingly.

Adding a New Address (Permission Required)
Only users with the correct permissions can add new addresses.
- Click the Add Address button (top right corner).
- Enter the required details:
- Property
- Full Address
- Address Nickname
- Latitude
- Longitude
- Registration ID
- Connected Devices
- Click Save to add the new address or Cancel to exit.
- From this panel, click to upload a CSV.
- From this panel click to download an address template.


Editing an Address (Permission Required)
Only users with the correct permissions can add new addresses.
- Locate the address in the table.
- Click the Edit icon ( ) in the Actions column.
- Modify the necessary details.
- Click Save to update the address information or Cancel to exit.
Deleting an Address (Permission Required)
Only users with the correct permissions can add new addresses.
- Locate the address in the table.
- Click the Delete icon ( ) under the Actions column.
- Confirm the deletion when prompted.
- The address will be removed from the system.
Exporting Address Data Address (Permission Required)
Only users with the correct permissions can add new addresses.
- Click the Export Data button at the top right of the page.
- Select a format (CSV or Excel) to download the address list.
- The exported file will include details like ID, Address, Associated Property, Registration Status, and Device Count.
4. Tooltips & Definitions
| Feature | Description |
|---|---|
| ID | Unique identifier assigned to each address. |
| Address | The specific unit, suite, or apartment address. |
| Associated Property | The property to which the address belongs. |
| Registration | Indicates the registration details of the unit. |
| Device Count | Number of water heaters or devices registered at this address. |
| Actions | Allows authorized users to edit or delete addresses. |
5. Troubleshooting Tips
| Issue | Possible Solution |
|---|---|
| Unable to see all addresses | Use the Current Property dropdown to filter by a specific property. |
| Cannot add a new address | Ensure you have the correct permissions. Contact an administrator if needed. |
| Edit icon not visible | Only authorized users can edit addresses. Confirm user permissions. |
| Delete icon not visible | Only users with deletion privileges can remove addresses. |
| Unable to export address data | Ensure you have the necessary permissions. Contact an administrator if required. |
Wrap Up
You’re now equipped with the tools and knowledge to navigate Fleet Commander confidently. Whether you’re monitoring devices, managing alerts, or reviewing usage trends, this guide is your foundation.
Armada Power Support
support@armadapower.com
Thank you for partnering with Armada Power to create a more flexible, efficient, and responsive energy grid.